یادداشت های یک دیتاساینتیست: یادگیری ماشین آن طور که در دنیای واقعی کار می کند
اگر تجربه برنامه نویسی داشته باشی، پایتون برایت یک زبان عجیب و غریب نیست. من بارها دیده ام کسی که قبلا با C# یا Java یا حتی JavaScript کار کرده، با چند جلسه تمرین ساده، خیلی راحت وارد پایتون می شود. نکته اینجاست: برای شروع یادگیری ماشین لازم نیست یک پایتون کار حرفه ای باشی. فقط باید چند ویژگی کلیدی زبان را بلد باشی تا همان چیزی که از قبل می دانی را سریع منتقل کنی.
هدف این درس در این سری مقاله دقیقا همین است: یک مرور سریع اما کاربردی روی پایتون و سه ابزار اصلی که در یادگیری ماشین مدام با آنها سر و کار داری: نامپای (NumPy)، مت پلات لیب (Matplotlib)، و پانداس (Pandas).
بعد از این درس باید بتوانی:
در کدهای پایتون راحت حرکت کنی و سینتکس را گم نکنی.
آن قدر NumPy و Matplotlib و Pandas را بلد باشی که اسکریپت های یادگیری ماشین را بخوانی و بنویسی.
یک پایه بسازی که بعدا روی آن، کارهای جدی تر یادگیری ماشین را راحت تر یاد بگیری.
اگر از قبل کمی پایتون می دانی، این درس برایت مثل یک یادآوری دوستانه است. اگر هم تازه می خواهی شروع کنی، اینجا دقیقا همان جایی است که باید با خیال راحت قدم اول را برداری.
وقتی تازه وارد پایتون می شوی، لازم نیست همه چیز را یکجا یاد بگیری. برای اینکه بتوانی کد را بخوانی و بفهمی، همین چهار موضوع کافی است:
انتساب (Assignment)
کنترل جریان (Flow Control)
ساختارهای داده (Data Structures)
توابع (Functions)
ما هر کدام را با مثال های کوچک و مستقل جلو می بریم. پیشنهاد من این است که همین مثال ها را واقعا تایپ کنی و اجرا کنی. با دیدن خروجی، موضوع در ذهن می نشیند.
یک نکته خیلی مهم: در پایتون فاصله گذاری معنی دارد. یعنی اگر جای فاصله ها اشتباه شود، برنامه یا اجرا نمی شود یا کار دیگری می کند. از همان اول این را جدی بگیر.
اگر برنامه نویسی بلدی، انتساب و نوع داده برایت غریبه نیست. ولی در پایتون چند چیز به شکل ساده تر انجام می شود.
# Define a sample text sample_text = "hello world" # Print the first character print(sample_text[0]) # Print the length of the text print(len(sample_text)) # Print the full text print(sample_text)
# Define a floating-point number
numeric_value = 123.1
# Print the current numeric value
print(numeric_value)

# Re-assign an integer value
numeric_value = 10
# Print the updated numeric value
print(numeric_value)
# Define boolean values
is_ready = True
is_finished = False
# Print both boolean values
print(is_ready, is_finished)
# Assign three values in one line
first_num, second_num, third_num = 1, 2, 3
# Print the unpacked values
print(first_num, second_num, third_num)
# Define a variable with no value yet
missing_value = None
# Print the None value
print(missing_value)
سه نوع کنترل جریان را در شروع لازم داری:
شرط ها
حلقه for
حلقه while
# Define a test value
speed_value = 99

# Check the value using conditions
if speed_value == 99:
    # Print when the value matches 99
    print("That is fast")
elif speed_value > 200:
    # Print when the value is too large
    print("That is too fast")
else:
    # Print for all other cases
    print("That is safe")
# Loop from 0 to 9
for index in range(10):
    # Print the current index
    print(index)
# Start the counter at zero
counter = 0
# Keep looping while counter is less than 10
while counter < 10:
    # Print the current counter
    print(counter)
    # Increase counter by 1
    counter += 1
سه ساختار داده که بیشترین استفاده را دارند:
تاپل (Tuple)
لیست (List)
دیکشنری (Dictionary)
# Define an immutable tuple
fixed_numbers = (1, 2, 3)
# Print the tuple
print(fixed_numbers)
# Define a mutable list
number_list = [1, 2, 3]
# Print the first element (index 0)
print("Zeroth Value:", number_list[0])

# Add a new value to the list
number_list.append(4)
# Print the updated list length
print("List Length:", len(number_list))

# Loop through each item in the list
for item in number_list:
    # Print the current item
    print(item)
# Define a dictionary (key-value pairs)
value_map = {"a": 1, "b": 2, "c": 3}
# Print the value for key "a"
print("A value:", value_map["a"])

# Update the value for key "a"
value_map["a"] = 11
# Print the updated value for key "a"
print("A value:", value_map["a"])

# Print all keys
print("Keys:", list(value_map.keys()))
# Print all values
print("Values:", list(value_map.values()))

# Loop through keys and print each value
for key in value_map.keys():
    # Print the value for the current key
    print(value_map[key])
# Define a function that sums two numbers
def sum_two_numbers(first_value, second_value):
    # Return the sum result
    return first_value + second_value

# Call the function with sample inputs
sum_result = sum_two_numbers(1, 3)
# Print the returned result
print(sum_result)
NumPy ستون فقرات محاسبات عددی در اکوسیستم SciPy است. مهم ترین مفهوم در NumPy، آرایه چندبعدی یا ndarray است.
import numpy as np

# Define a Python list
python_list = [1, 2, 3]
# Convert the list to a NumPy array
numpy_array = np.array(python_list)

# Print the NumPy array
print(numpy_array)
# Print the shape of the array
print(numpy_array.shape)
import numpy as np

# Define a nested list (2D data)
two_dimensional_list = [[1, 2, 3], [3, 4, 5]]
# Convert the nested list to a NumPy 2D array
matrix_array = np.array(two_dimensional_list)

# Print the full matrix
print(matrix_array)
# Print the matrix shape (rows, cols)
print(matrix_array.shape)

# Print the first row
print("First row:", matrix_array[0])
# Print the last row
print("Last row:", matrix_array[-1])
# Print a specific element (row 0, col 2)
print("Specific row and col:", matrix_array[0, 2])
# Print the entire third column
print("Whole col:", matrix_array[:, 2])
import numpy as np

# Define the first array
left_array = np.array([2, 2, 2])
# Define the second array
right_array = np.array([3, 3, 3])

# Add arrays element-wise
print("Addition:", left_array + right_array)
# Multiply arrays element-wise
print("Multiplication:", left_array * right_array)
اینجا همان جایی است که من همیشه روی آن تاکید می کنم: Matplotlib را سرسری نگیر. چون خیلی از خطاهای تحلیل، با یک نمودار ساده مشخص می شوند. چاپ کردن عددها به تنهایی کافی نیست. باید داده را ببینی.
روش کار معمول با Matplotlib معمولا این شکلی است:
یک تابع رسم را روی داده صدا می زنی (مثل plot یا scatter)
چند تابع برای تنظیم ویژگی ها می زنی (مثل برچسب محور)
در آخر نمودار را نمایش می دهی (show)
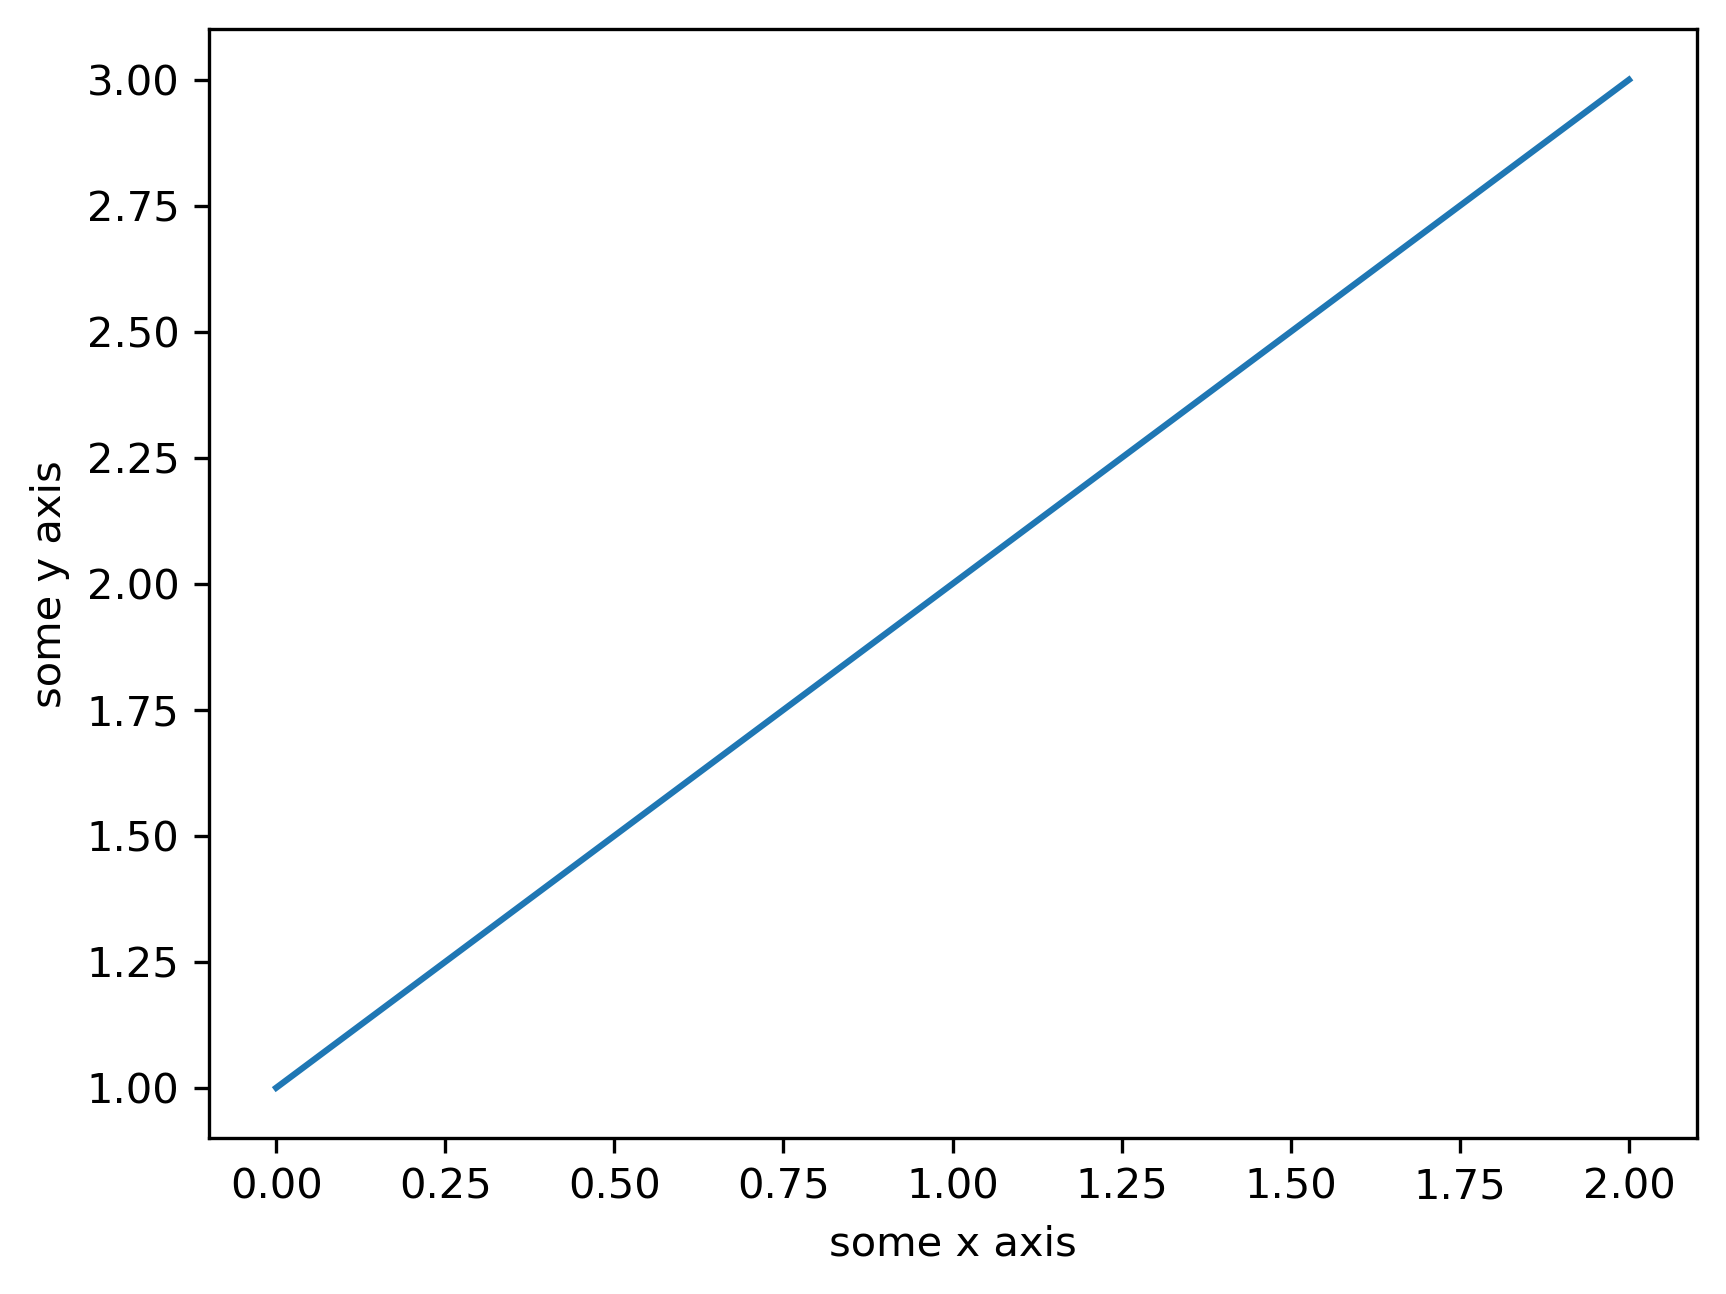
import matplotlib.pyplot as plt
import numpy as np

# Define 1D data for the line plot
line_values = np.array([1, 2, 3])

# Create the line plot
plt.plot(line_values)
# Label the x-axis
plt.xlabel("some x axis")
# Label the y-axis
plt.ylabel("some y axis")
# Show the plot window
plt.show()
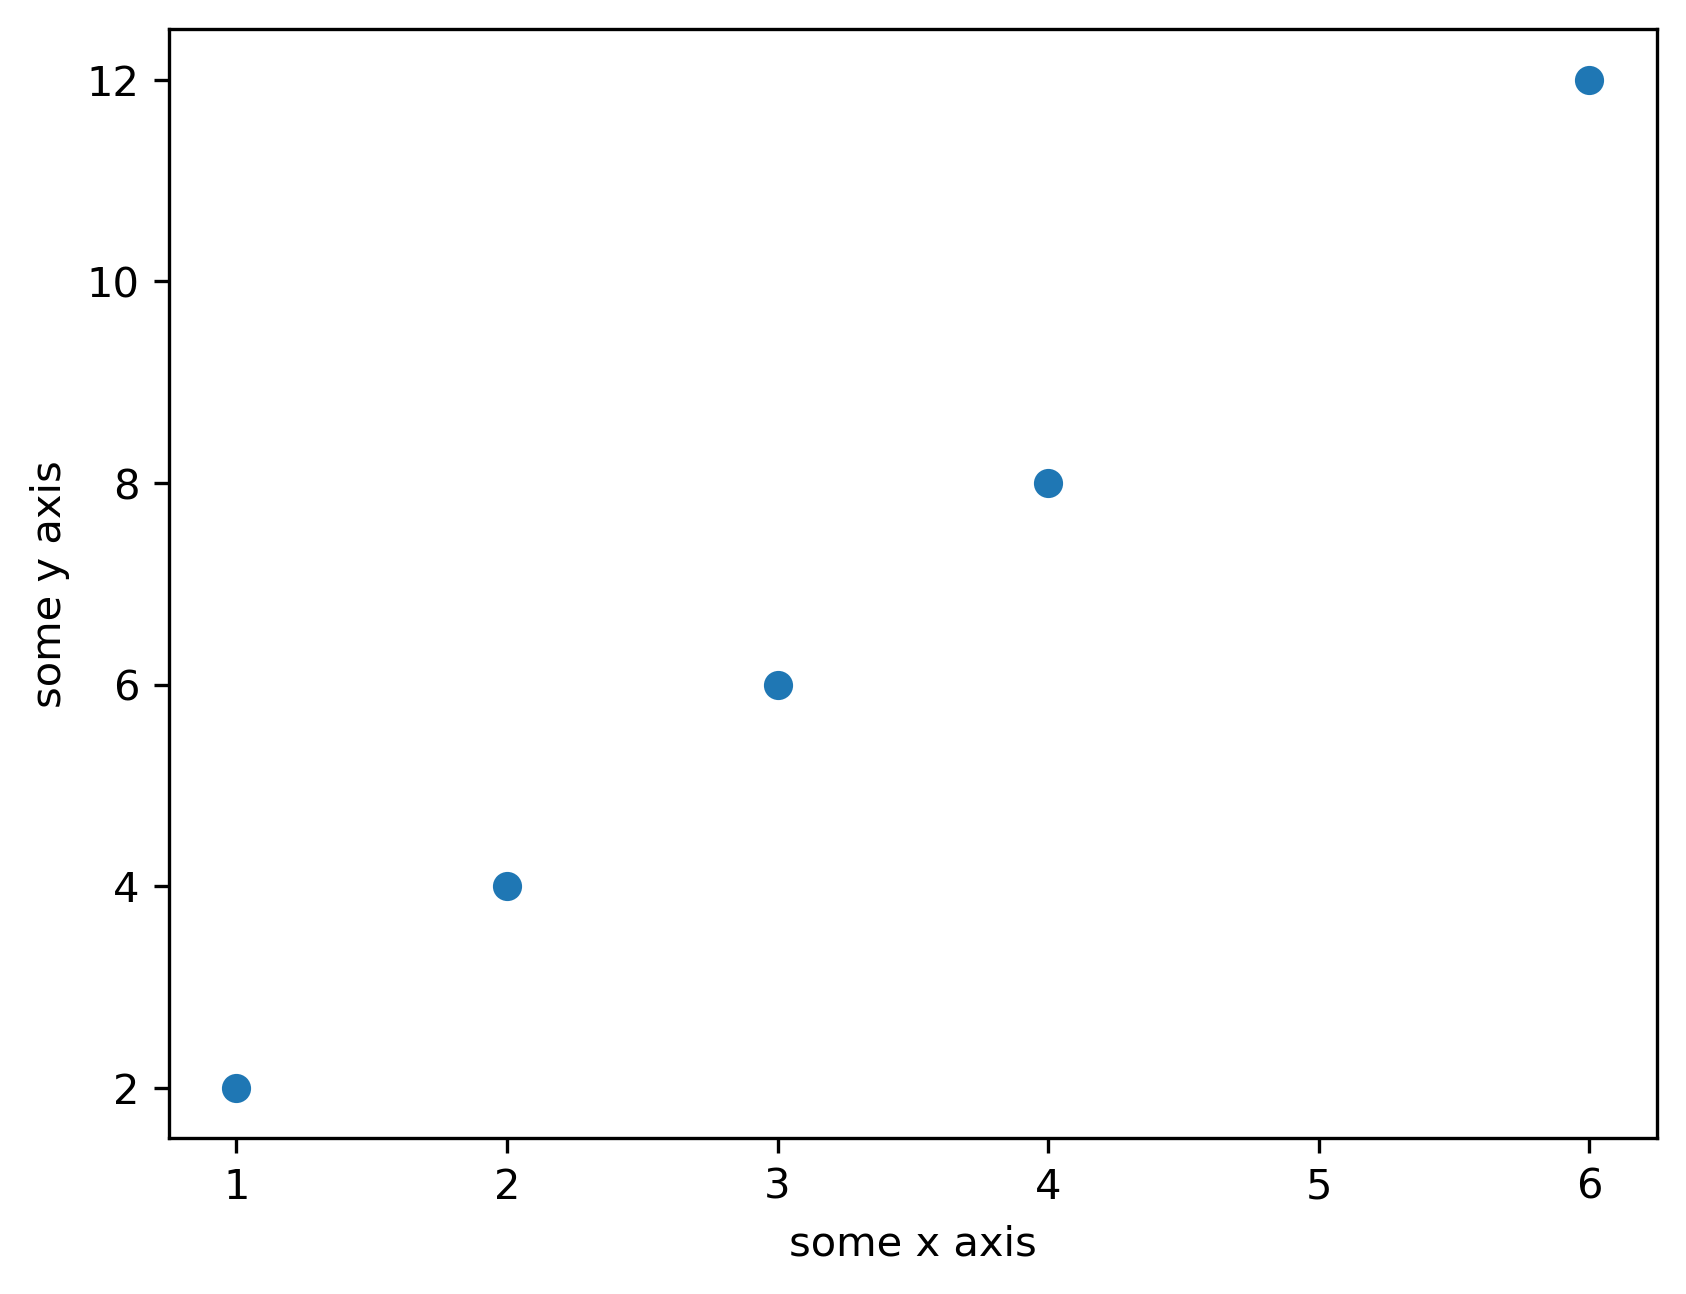
import matplotlib.pyplot as plt
import numpy as np

# Define x values
x_values = np.array([1, 2, 3])
# Define y values
y_values = np.array([2, 4, 6])

# Create the scatter plot
plt.scatter(x_values, y_values)
# Label the x-axis
plt.xlabel("some x axis")
# Label the y-axis
plt.ylabel("some y axis")
# Show the plot window
plt.show()
Pandas ابزار اصلی کار با داده های جدولی است. دو مفهوم کلیدی:
سری (Series)
دیتافریم (DataFrame)
import numpy as np
import pandas as pd

# Define 1D data
series_values = np.array([1, 2, 3])
# Define row labels
row_labels = ["a", "b", "c"]

# Create a Pandas Series with labels
labeled_series = pd.Series(series_values, index=row_labels)
# Print the full series
print(labeled_series)

# Access the first value by position
print(labeled_series[0])
# Access the value by label
print(labeled_series["a"])
import numpy as np
import pandas as pd

# Define 2D data
table_values = np.array([[1, 2, 3], [4, 5, 6]])
# Define row labels
row_labels = ["a", "b"]
# Define column labels
column_labels = ["one", "two", "three"]

# Create a DataFrame with row and column labels
data_table = pd.DataFrame(table_values, index=row_labels, columns=column_labels)
# Print the full DataFrame
print(data_table)

# Access one column using bracket notation
print("method 1:")
print(data_table["one"])

# Access one column using dot notation
print("method 2:")
print(data_table.one)
در این درس، کلی زمین را پوشش دادیم، اما همه چیز حساب شده بود:
با سینتکس پایه پایتون آشنا شدی (انتساب، شرط، حلقه، ساختارهای داده، تابع)
یاد گرفتی NumPy چطور داده عددی را شکل می دهد و با آن محاسبه می کند
Matplotlib را جدی دیدی و دو نوع نمودار مهم را ساختی
و فهمیدی Pandas چطور داده جدولی را به شکل Series و DataFrame مدیریت می کند
اگر همین بخش ها را خوب تمرین کنی، از این به بعد وقتی یک اسکریپت یادگیری ماشین می بینی، حس نمی کنی یک متن ناشناخته جلوی تو گذاشته اند.
در درس بعدی، وارد یک بخش کاملا کاربردی می شویم: بارگذاری مجموعه داده های استاندارد یادگیری ماشین در پایتون. یعنی همان چیزی که در پروژه های واقعی همیشه نقطه شروع است: داده را چطور سریع و درست وارد کنیم و آماده تحلیل کنیم.